To Stay Biologically Young: Can You Out-Exercise A Poor Diet?
Part 2: Why You Can’t Rely On One-Size-Fits-All Exercise Prescriptions.
This post as a video.
STORY AT-A-GLANCE
- What is new: Translating the results of exercise intervention studies to you, the individual, is flawed with problems of mismatched profiles, mistaken effectiveness, and misleading effect sizes.
- Why it matters: When it comes to preventing ageing-associated diseases and disabilities you need to know NOW whether your lifestyle interventions will deliver in the future as advertised. You don’t want to find out only once that future has arrived.
- What is next: To stay biologically young, exploit exercise intervention studies as a compass to find time-saving exercise routines. Use the latest technologies and a unique solution to test-drive those routines, and get real-time feedback on how they affect your rate of biological aging.
Remember what I said in episode 1 about how the mechanical stress of increased blood flow triggers the endothelial cells to relax the arterial walls?
There is a stress threshold below which this does not happen.
“Walking the dog, mowing the lawn, or playing golf will not necessarily do the trick.”
And then there seems to be a ceiling, too. I emphasize the word “seems” because the evidence is conflicting.
While one review concluded that excessive loads of high-intensity training may undo the beneficial effects of exercise on endothelial function [1], another found no detrimental effects of ultra-endurance sports on arterial stiffness [2].
For obvious reasons, most of us will never have to worry about doing too much.
So, the million-dollar question is, what is too little, and, most importantly, what is enough to deliver you into the SUPERNOVA Champions League of vascular aging.
This question has attracted a lot of research.
In this post I’ll tell you about the FITT principle, how researchers use it to come up with exercise prescriptions, and why you cannot rely on them.
The FITT Principle
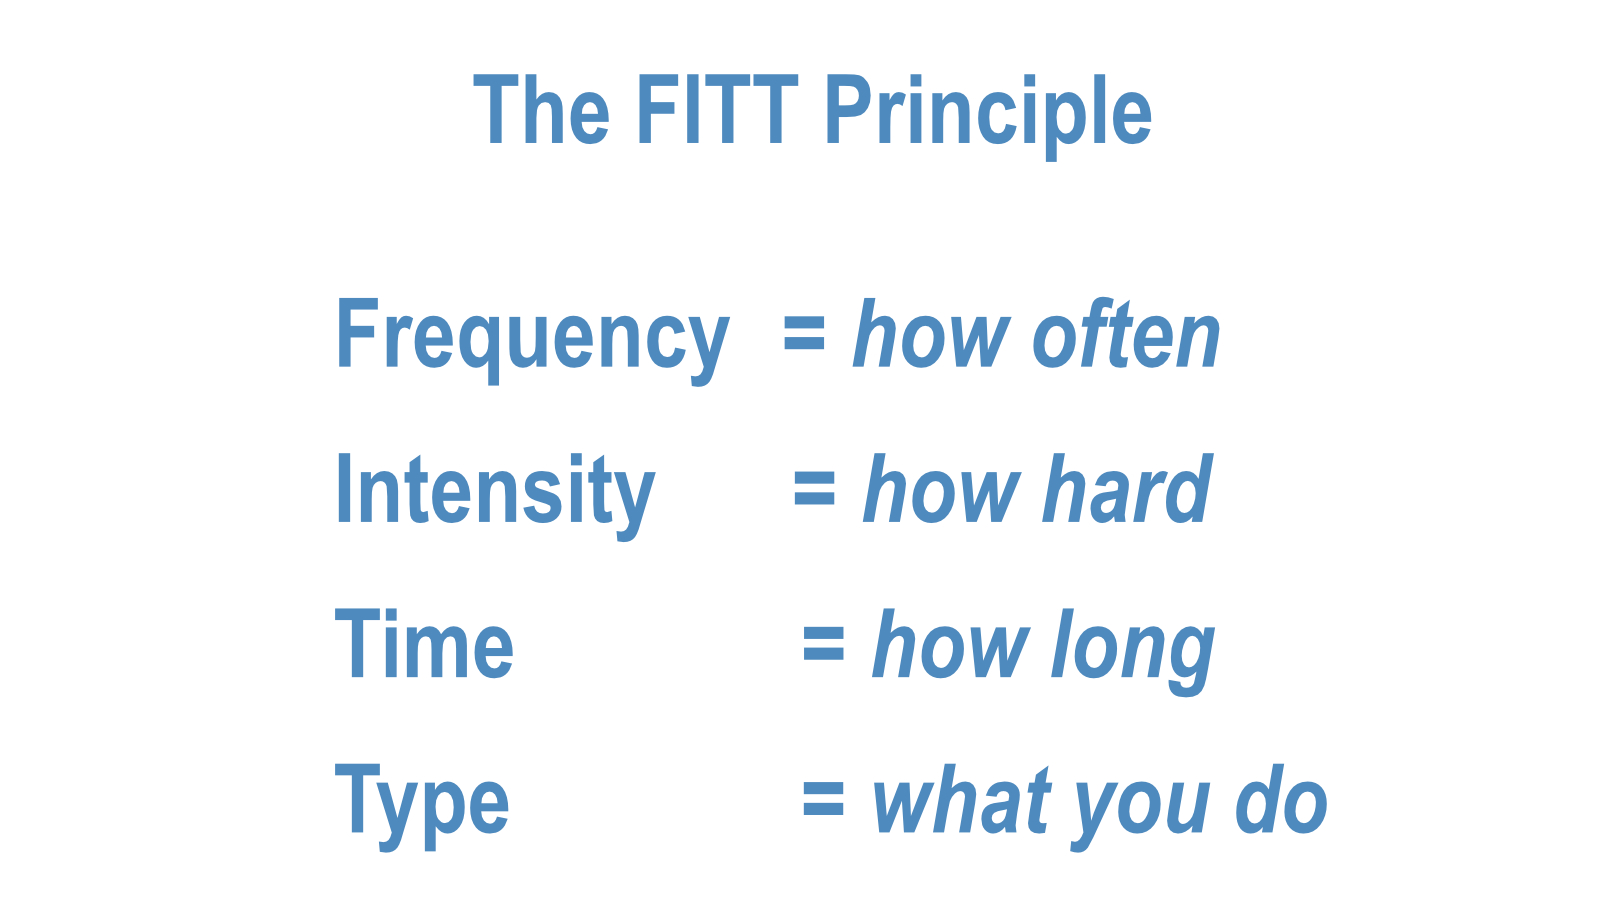
FITT sounds simple enough: Just find the right combination of exercise frequency, intensity, duration and type.
Legions of researchers have been using the FITT principle to study the effects of different modes of exercise on anything from body weight, to blood pressure, to biological age.
The problem is, you cannot translate those results to YOU personally. Not reliably.
There are three reasons for this unreliability:
- Profile Mismatch: between study participants and you
- The deceptive average effect
- The unknown Detection Limit: your before-after measurements conceal the true effects
We will look at each of these three individually, and then find out how you can overcome these obstacles.
Profile Mismatch
While FITT looks straightforward, it isn’t.
If we stratify each of the 4 FITT components into just 3 different categories, we have already 81 different combinations. Each one will produce slightly different results.
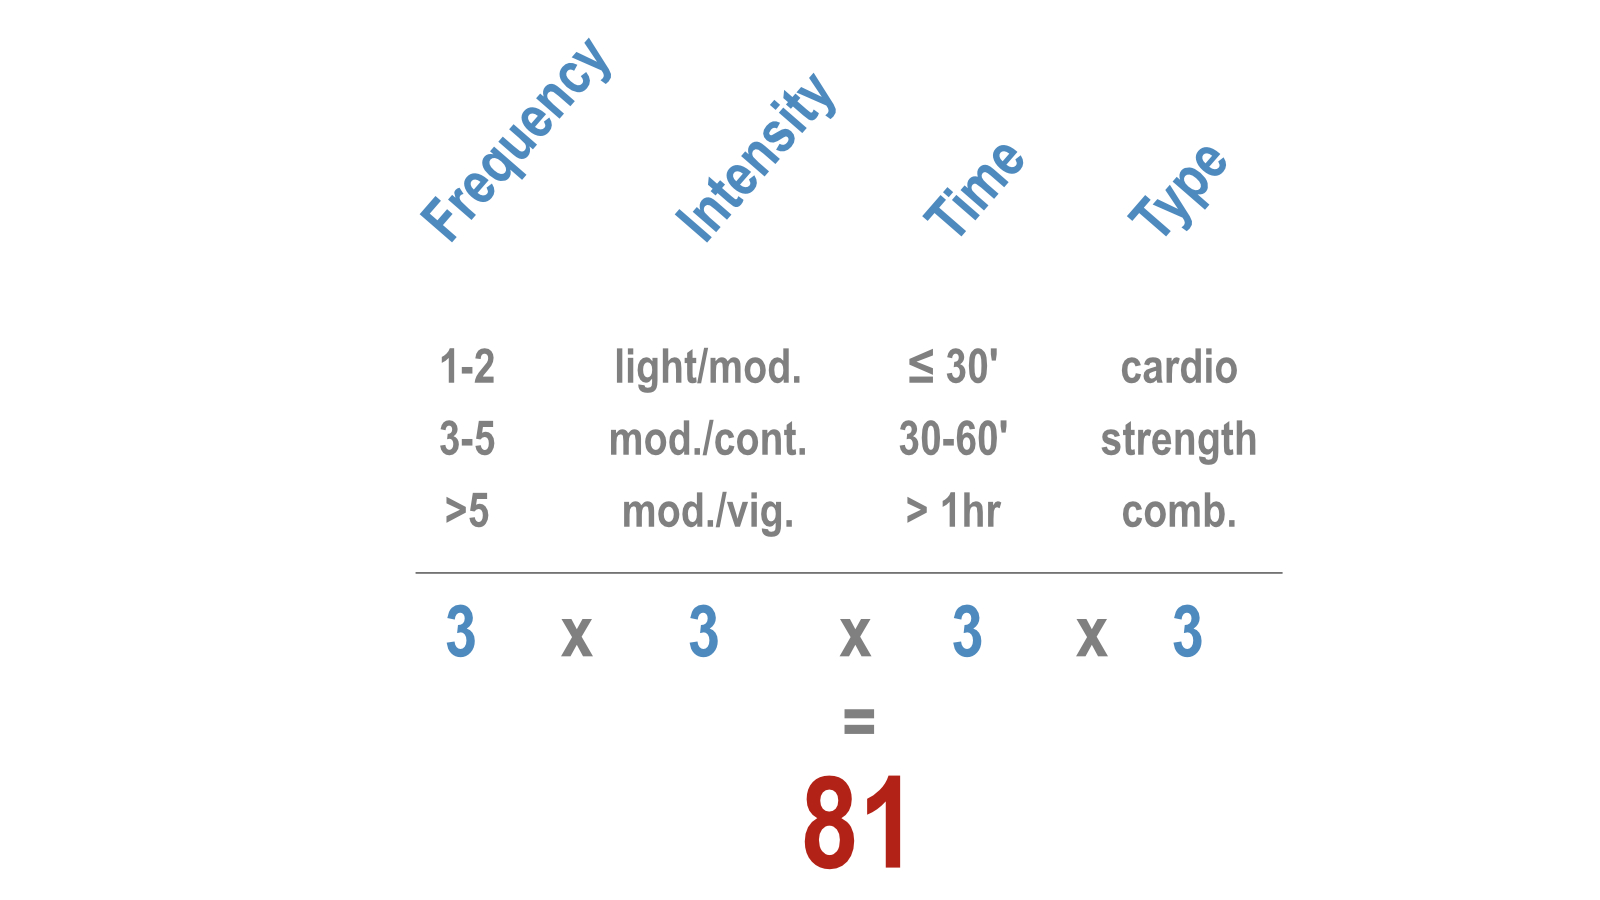
Moreover, everybody responds differently to the same FITT configuration. That’s because age, sex, exercise history, and individual health conditions play a large role. Even if we stratify all these into just a few categories, you’ll end up with thousands of possible combinations.
And we haven’t even considered genetics, yet.
For practical reasons, researchers need to largely ignore these combinations when designing their studies. Now to…
The fallacy of the average
I have discussed the fallacy of the study average in a previous post, so here is just a brief reminder:
Researchers present intervention effects as an average for a group of participants. For example: one study concluded that
aerobic interval training reduces PWV in previously sedentary young healthy women by 0.5 m/s ON AVERAGE [3].
As far as PWV goes, that’s an impressive improvement.
But when you break this average down to the level of the individual study participant, you notice that the average participant doesn’t exist.
Only One of the 16 women came close to the average of 0.5 m/s.
But if the average effect doesn’t even apply to most of the study participants, how can you be sure it will apply to you?
Which brings me to the third obstacle:
The detection limit – the minimal detectable change
In the study I just mentioned the bandwidth of PWV change ranged from a reduction of 1.3 m/s to an increase of 0.3 m/s.
Now I’m going to ask you a question that may sound weird, but here it is:
If you were one of the participants how would you know whether your PWV has truly changed?
To answer that question, you would need to know whether your before-and-after scores were your TRUE PWV at that time.
Now here is the amazing thing:
We can never know the true score of any biomarker from just one measurement.
No matter how accurate our measurement devices are, they can never tell us the true PWV, blood pressure, heart rate, or whatever biomarker we are after.
The reason is that every biomarker varies over time. For nearly all cardiovascular biomarkers that time frame is typically so short – moment to moment, or heartbeat to heartbeat – that you’ll get different results even if you do the measurements one after another.
So, how to find your true biomarker score?
Simple, by measuring it repeatedly under the same condition and then taking the average of those scores. This average – the mean – is as close as we can get to the true score.
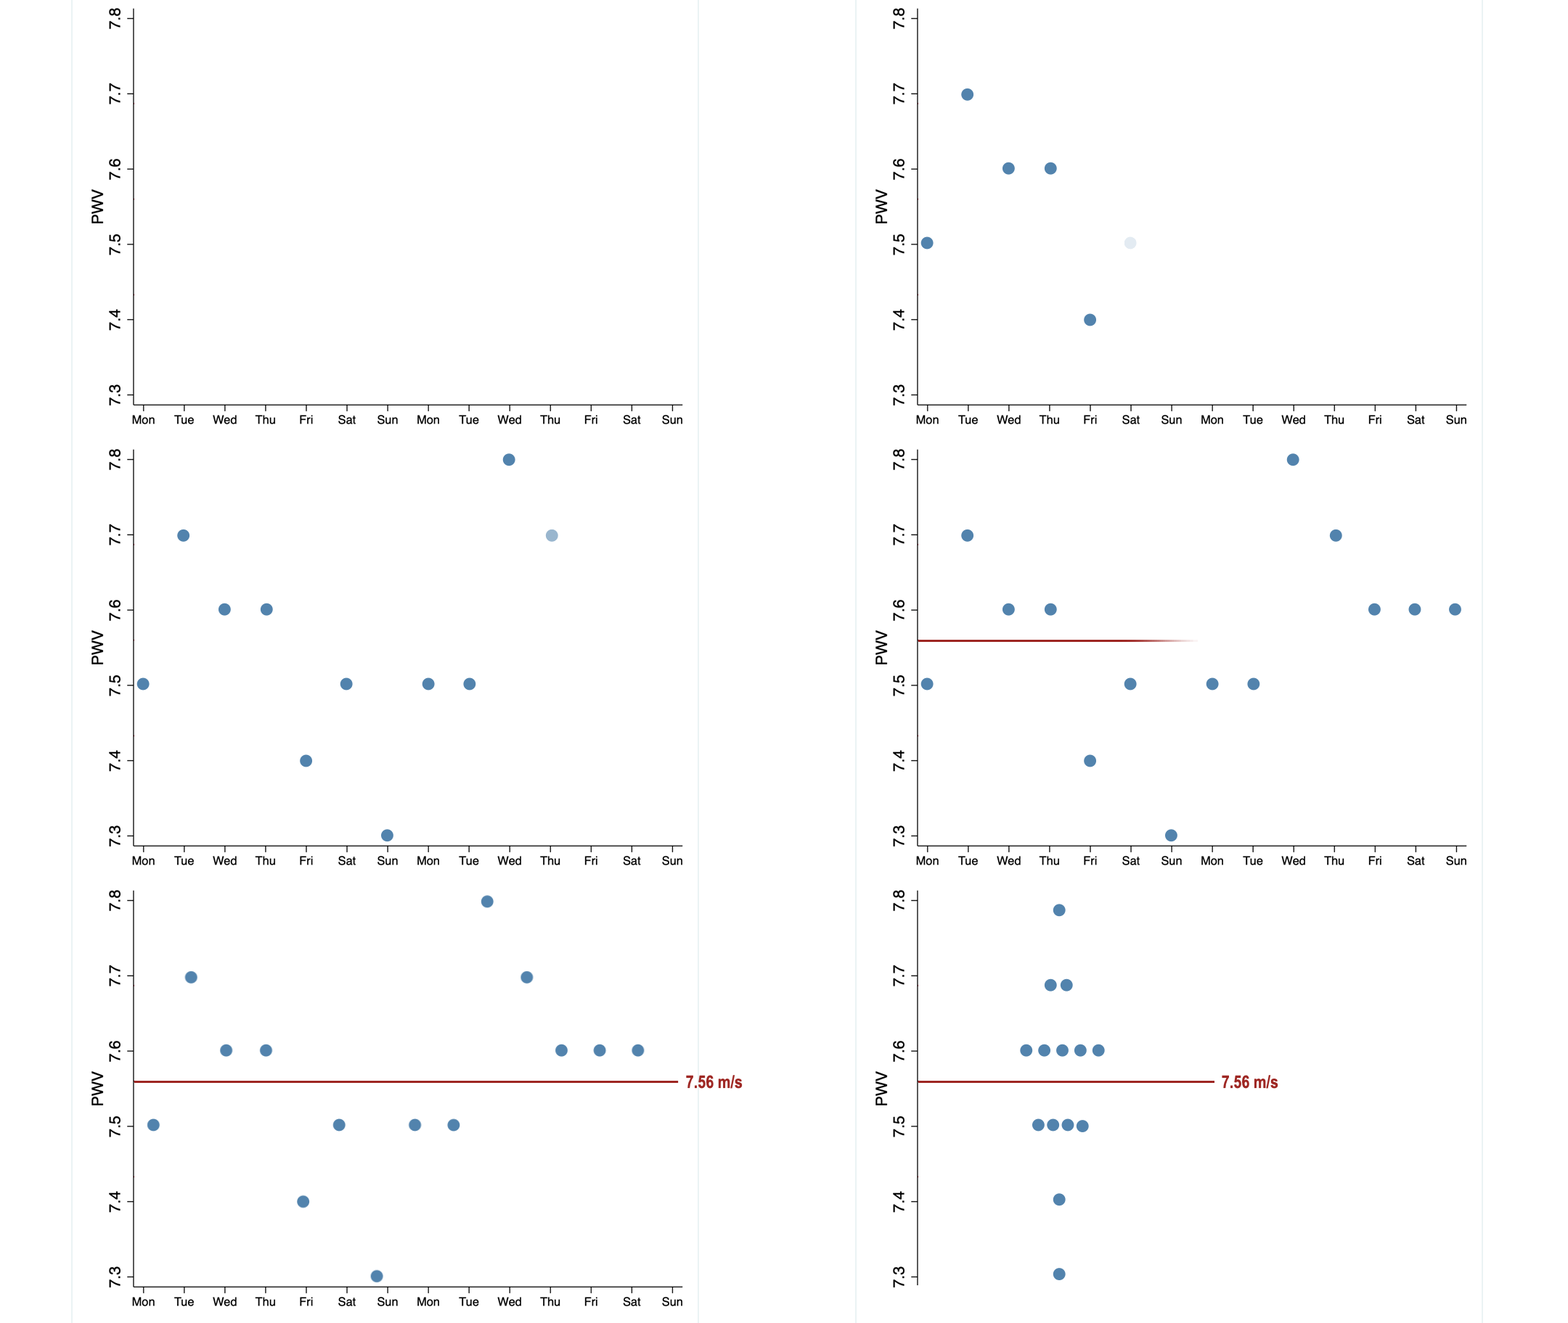
Repeated measurements give you two more vital pieces of information, which you need to answer my weird question.
- the variability of your scores
- the minimal detectable change
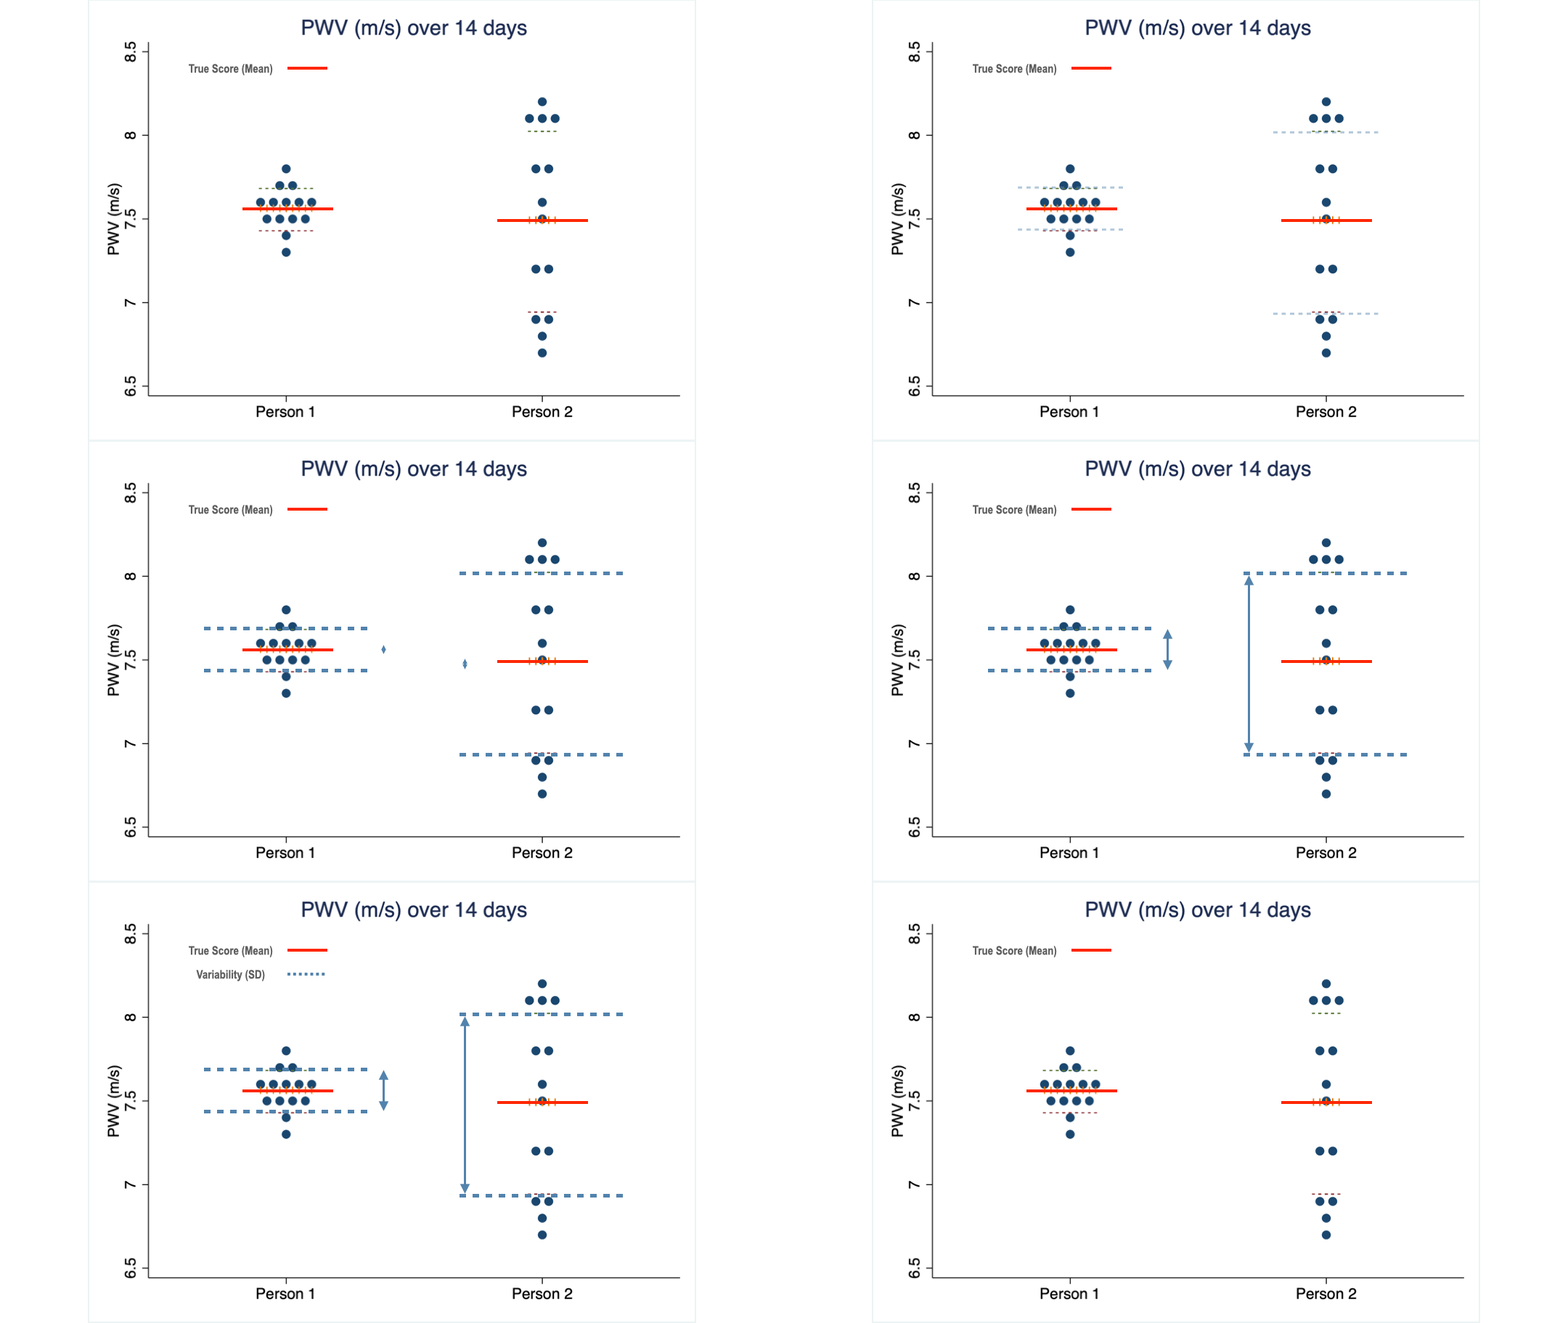
The following graph illustrates these two concepts.
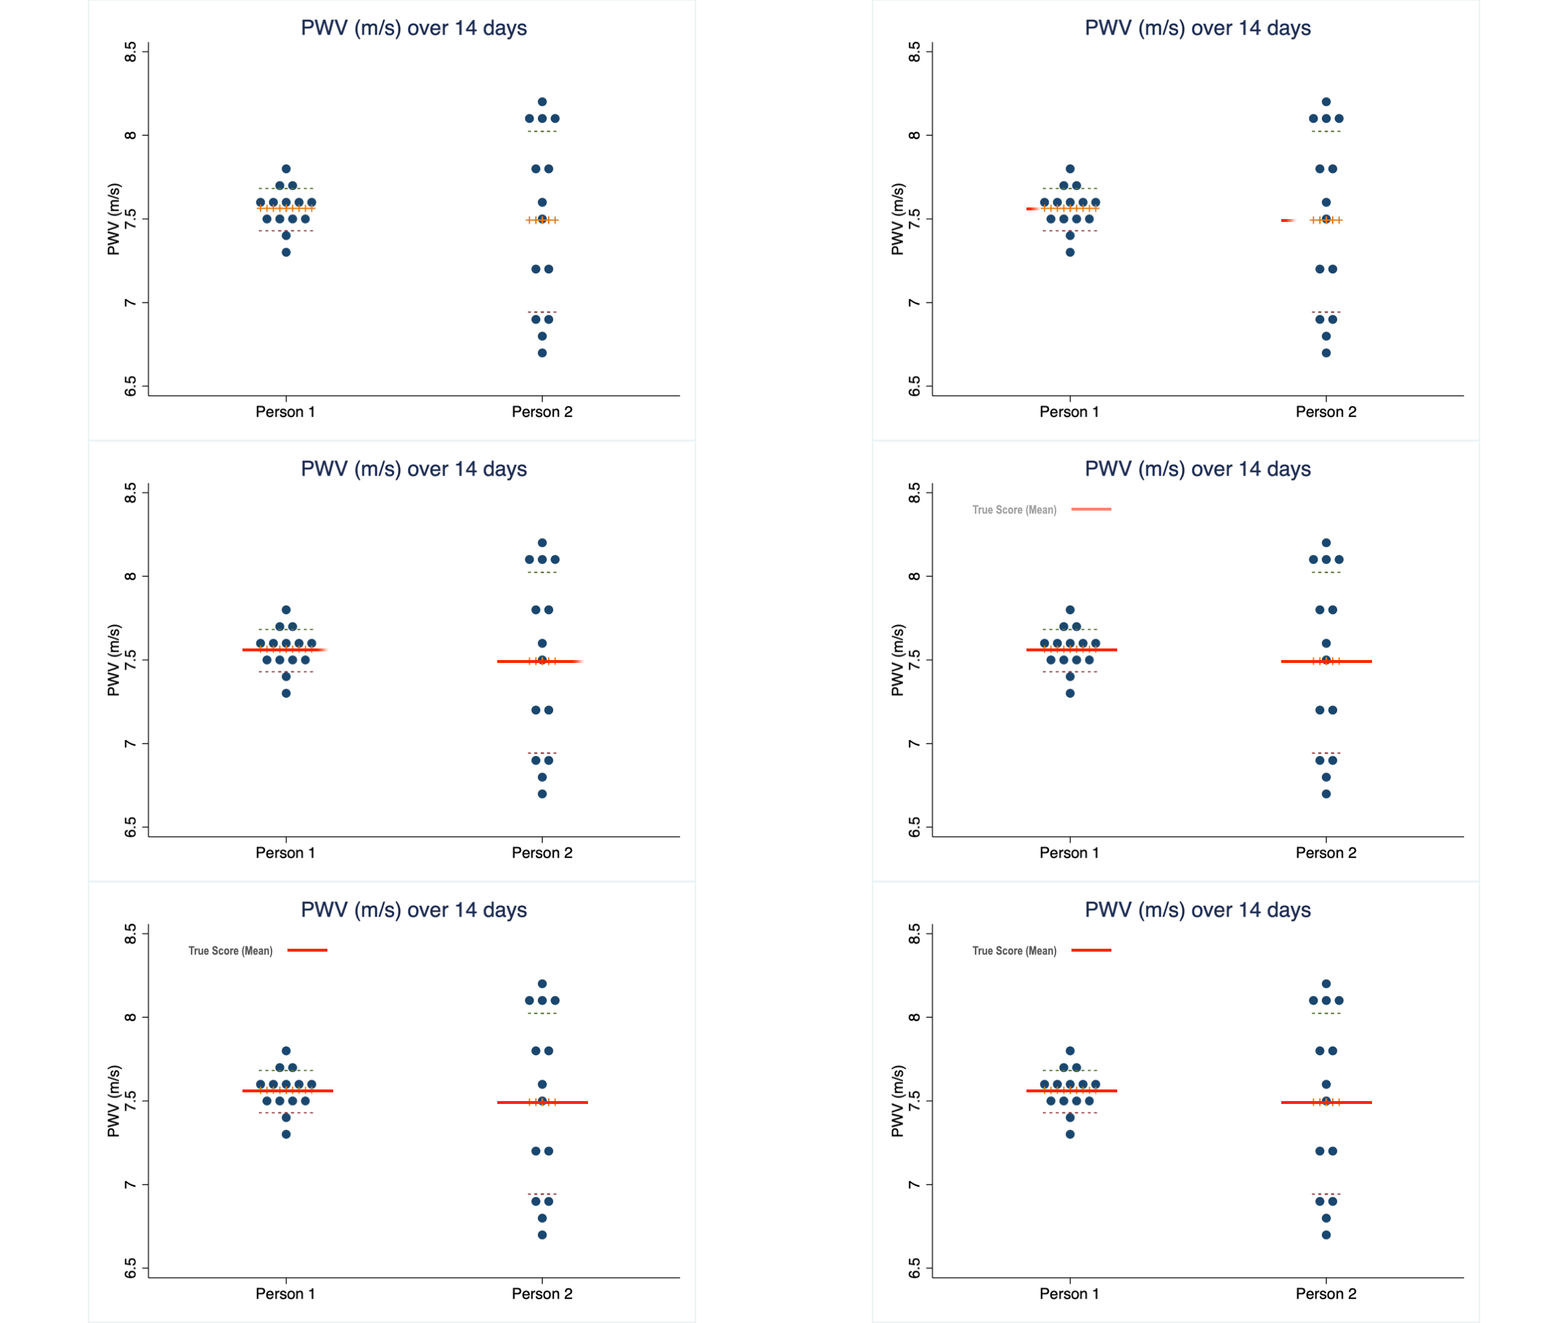
What you see are 14 PWV measurements taken from two of my clients over 14 consecutive days. Their average score is almost identical: 7.5 m/s, the same as the 16 women I mentioned earlier.
But the scores of client 2 are spread over a much wider range (we call it the standard deviation) than those of client 1.
Obviously, client 2 needs to see a much larger change than client 1 to be confident that her PWV has truly changed.
This brings us to the so-called…
Minimal detectable change (MDC).
Minimal detectable change (MDC) is a statistical measure that tells you how much your PWV score has to change before you can be confident that it’s not just a fluke. Once we have a sequence of measurements for a person, we can calculate this MDC.
The green arrows illustrate the size of the MDC values for each of my two clients. For client 1 a change of 0.2 m/s is the threshold above which he can be reasonably confident that the change from before to after an intervention is a true effect of it.
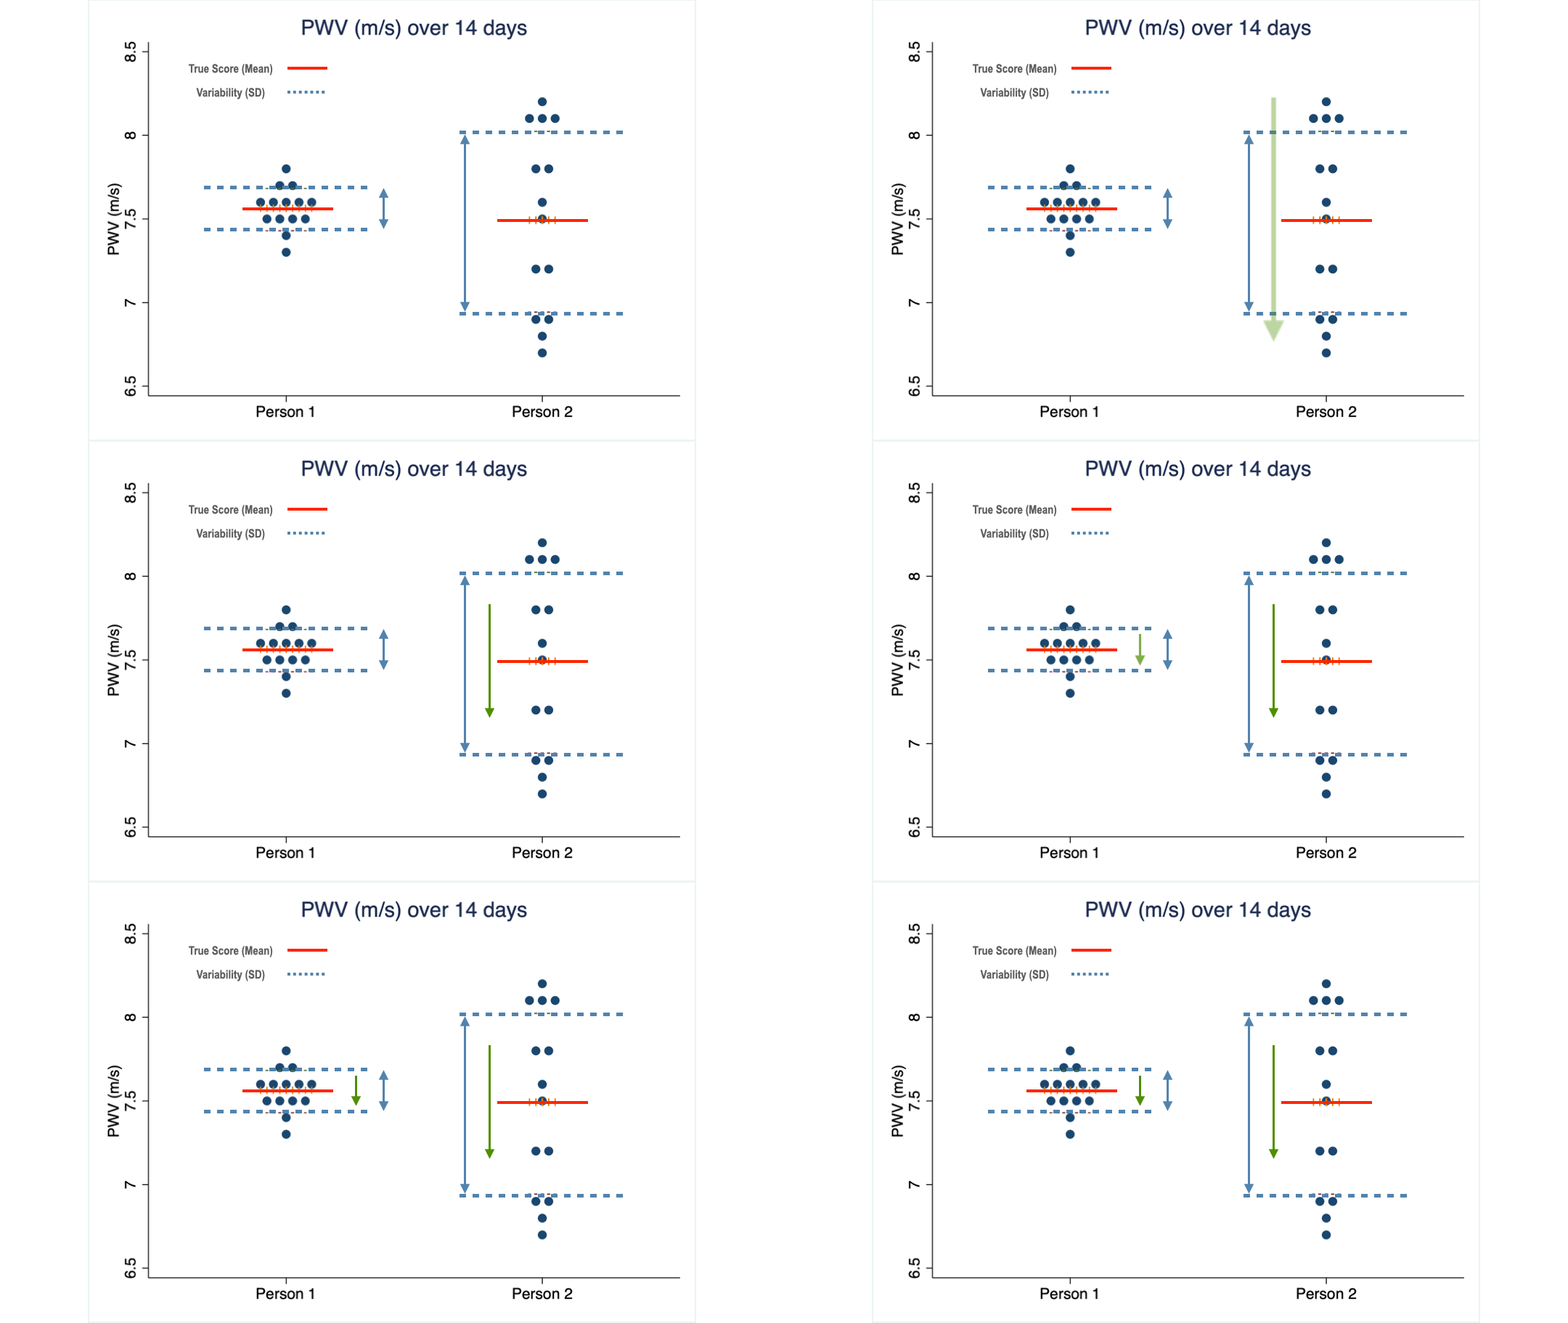
Client 2 on the other hand needs to see a change larger than 0.6 m/s to come to the same conclusion.
So, back to my provocative question:
How do we know whether the PWV of an individual study participant has TRULY changed?
The answer is we cannot know. Not from a pair of single before-and-after scores.
For research done on groups of people, that does not matter. The research is supposed to answer the question of whether an intervention has a significant effect on a GROUP of people.
But when it comes to you trying to replicate the intervention, you are a group of 1. That is, measuring your biomarker before and after an intervention will not help you detect whether your intervention really helps you.
As an aside, this issue is a real problem when it comes to diagnosing and treating hypertension. As I have shown in a previous post, medical decision-making based on blood pressure measurements taken weeks or months apart inevitably leads to a number of people being wrongfully diagnosed as hypertensive, or resistant to drug treatment, when they are not. And on the opposite end of the scale, some hypertensives will stay below the diagnostic radar.
Back to our PWV scenario and your attempt to improve it.
Now you understand why it is wrong to translate all those published study results into one-size-fits-all recommendations. And that’s why a recent literature review on the subject concluded that…
“Evidence is lacking when it comes to the choice of optimal training programs for the individual.” [4]
Does that mean, all those studies are useless for you?
No, far from it. They work like a compass. They give you general directions, a basket of interventions to try.
But without real-time feedback on the true effects of those interventions you will be flying blind. To unblind you, you need the ability to measure and evaluate PWV, or any other relevant biomarker, as and while you test-drive those interventions.
That’s what our team has operationalized for laypersons.
But before we get there, I’ll introduce you in the next post to the best time-saving exercise routines with the greatest potential to deliver you into the SUPERNOVA category of vascular aging.
In the post after that, I’ll show you how our lifestyle navigator helps you to get there fast and efficiently. In that episode you will discover that
- Monitoring your PWV is as easy and simple as stepping on a special bathroom scale
- Translating those scores into your rate of vascular aging is a push-button exercise on a special web application
- Transforming yourself into a biologically younger you doesn’t cost you an arm and a leg. On the contrary.
I’ll let you have a glimpse at our scientific research and development work, and disclose the government funding that has supported it.
So, stay tuned, and see you in the next two posts.
PS
Feel free to leave a comment or contact me directly below.
References
[1] O’Keefe JH, O’Keefe EL, Eckert R, Lavie CJ. Training Strategies to Optimize Cardiovascular Durability and Life Expectancy. Mo Med 2023;120:155–62.
[2] Radtke T, Schmidt-Trucksäss A, Brugger N, Schäfer D, Saner H, Wilhelm M. Ultra-endurance sports have no negative impact on indices of arterial stiffness. Eur J Appl Physiol 2014;114:49–57. doi:10.1007/s00421-013-2753-1.
[3] Ciolac EG, Bocchi EA, Bortolotto LA, Carvalho VO, Greve JM, Guimaraes G V. Effects of high-intensity aerobic interval training vs. moderate exercise on hemodynamic, metabolic and neuro-humoral abnormalities of young normotensive women at high familial risk for hypertension. Hypertens Res 2010. doi:hr201072 [pii] 10.1038/hr.2010.72.
[4] Königstein K, Dipla K, Zafeiridis A. Training the Vessels: Molecular and Clinical Effects of Exercise on Vascular Health—A Narrative Review. Cells 2023;12. doi:10.3390/cells12212544.


0 Comments