The first downloadable BioAge clock for everyone to use, the science behind it, and a creator’s personal example.
What is new?
Biological age not only shows up on your face it also beats calendar age as a predictor of health- and lifespan. But biological age estimation has been the privilege of research labs. In this post I provide, for the first time, access to a BioAge calculator everyone can use.
Why it matters
To look younger is a powerful motivator for lifestyle optimization. Giving everyone access to a BioAge tool may save many from unnecessary future disease, dementia, and disability.
What is next?
A platform for everyone to share their experience, and to refine the “BioAge Clock For Everyone”
Have you ever lied about your age? Medical science has just legitimized that lie [1]. At least for those who can get away with it:
“the answer to the question “Is (chronologic) age really just a number?” is a resounding “yes” and that it may be time to use biologic age and forget about chronologic age…”
The signs have been popping up in research for at least 15 years: The difference between perceived age (perceived by oneself and others) and calendar age is an astonishingly useful clinical biomarker for estimating future health. And it correlates well with biological age, as the most recent research confirms.
The weird science about how looking younger makes you live longer
Kaare Christensen and his team demonstrated as much in 2009 [2]. In their study of 1826 Danish twins aged ≥70, three independent groups of assessors (nurses, university students, and older adults) rated the twins’ passport-type color photographs for perceived age.
The individuals perceived as biologically older (as compared to their chronological age) died faster, suffered more physical and mental impairments, and had shorter telomeres than their biologically younger peers.
I’ll use the term “biologically older” (or younger) to mean older (or younger) than calendar age.
Just look at Figure 1 below.
Figure 1
In the youngest age group, the mortality rate for the biologically older men was more than twice the rate of the biologically younger guys. For women, it was worse: to be biologically older means dying at three times the rate compared to being biologically younger.
Perceived age also predicted all measures of physical and cognitive function, even after adjusting for chronological age.
That is, perceived age adds clinical information to chronological age.
That is no small feat. When it comes to estimating future risk, say for cardiovascular disease or death, chronological age is the elephant in the room. It outweighs all other known risk factors combined (hypertension, diabetes, high cholesterol, etc.).
So, the authors concluded:
“perceived age based on facial photographs is a robust biomarker of aging that does not depend on the sex, age, and professional background of the assessors”.
Meaning, no matter whether it’s you, a doctor, or a college kid telling me that I look older than I am (chronologically), I should start doing something about it.
That is diagnostic power to the (lay-)people, isn’t it?
For you and me, to wait until we are north of seventy would not be the cleverest strategy. For researchers, it is different because, in that age group, they’ll observe enough deaths over a manageable follow-up period to come to their conclusions.
But how about people half that age?
BioAge works for the young, too
Daniel Belsky and his team wondered about that, too. They asked three questions [3]:
- Are young adults aging at different rates?
- Do young adults who are aging faster feel and look older?
- Does accelerated aging in young adults influence indicators of physical function?
The quick answer to all three questions was a resounding “yes.”.
Belsky’s study cohort consisted of 1,037 members of the Dunedin Multidisciplinary Health and Development Study, which tracks the development of individuals born in 1972–1973 in Dunedin, New Zealand. At the time of the study, all members were 38 years old. They had been followed up for the preceding 12 years (with measurements starting at age 26).
Are young adults aging at different rates?
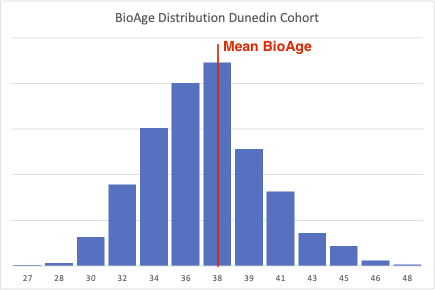
The researchers constructed a pace-of-aging biological clock (PoA clock) using 18 blood biomarkers. They scaled the biomarker profiles such that the cohort’s average pace of aging was one year of physiological change per calendar year.
As you can see from the figure below, individual members of the cohort aged at vastly different rates, from 0 to more than 2 years per year. That is, 24 years instead of 12 years, which brings those unlucky individuals to a biological age closer to 50 than to 40.
Figure 2
Do young adults who are aging faster feel and look older?
A group of undergraduates (unaware of the participants’ chronological age and all other study details) rated the participants’ pictures for their perceived age. The raters’ age assessments correlated very well with the results of the PoA clock. That is, the cohort members whose PoA clock ticked at a faster pace looked older to the raters, and they perceived themselves as having aged faster.
Does accelerated aging in young adults influence indicators of physical function?
Those who aged faster performed worse on physical and cognitive function tests, and they rated themselves as having poorer health.
What it all means
Belsky’s study was one of the first to show that (a) the pace of aging can be quantified by a suitably constructed clock, and (b) such a clock detects physiological changes long before their consequences manifest as overt age-related disease.
That was in 2015. Today, we know from Belsky’s follow-up studies that lifestyle interventions that are known to extend health- and lifespan also slow down PoA clocks [4].
Belsky’s observations support the geroscience hypothesis [5] that:
“Interventions to slow or reverse changes that occur with aging can delay or prevent multiple chronic diseases and extend healthy lifespan.”
Your first take-home message
There is a biological clock ticking in every one of us that either keeps us healthy if it runs slower than the clock on our wall or lets us circle the drain otherwise. No matter at which calendar age we find ourselves.
This raises two questions:
- How can YOU measure your biological age and your rate of aging? (You don’t want to depend on other people’s perception.)
- Can you turn back or slow down that clock? And will that affect your health span? (After all, turning back the clock on your wall won’t postpone sunset?)
How to measure biological age (to be useful for you)
The definition of aging
Before we can talk about how to measure biological age and the pace of aging, we need to get on the same page about “what IS aging?”.
Many people who are cleverer than I have devoted oodles of time and paper to answering that question. But, believe it or not, they still can’t agree on a universal definition [6].
I won’t bore you with the details.
My approach to the question is purely practical: Since we all age differently, I want to know how to define and measure this process using all its modifiable aspects.
Those who agree with me on practicality seem to agree on the following definition of aging [6]:
“Aging is the progressive decline of function with increasing chronological age.”
Simple and practical.
Function is something we can measure: on a whole-body level, like fitness (endurance, strength, or even cognitive function), on an organ level, and even on a cellular level.
But currently available BioAge and PoA clocks are useless for you (with the exception of the one that I’ll show you). Belsky’s is no exception. Here is why:
Currently used BioAge clocks: The ones you can ditch
They all operate on the cellular level. That puts them out of your reach for two reasons.
First, you can’t use them without access to a lab, expensive equipment, and invasive tissue sampling.
Second, they don’t tell you anything about how fit you are or will be, how mentally sharp you are, or how independent you are.
The cellular level is the hallmark of the reductionist camp of scientists. That is, those who believe that an understanding of each of a machine’s (or organism’s) parts will explain the function of the entire machine.
Reductionist scientists have now identified 12 cellular hallmarks of aging [7]. Consequently, these researchers have developed various BioAge clocks that combine various sets of these cellular biomarkers to predict chronological age. The further away your predicted age from your calendar age, the faster, or slower, you age biologically.
But all these clocks measure different things and come to different age estimates, and it is entirely unclear whether resetting or manipulating a person’s BioAge clock will affect their health- and life expectancy [8]. They don’t even detect the changes that show up in the PoA clocks [4].
I’ll give you two examples:
The inconclusive telomere story
Remember the telomere lengths that I mentioned in the Danish study? Telomeres are regions of repeated DNA sequences that cap the ends of chromosomes. They work like aglets, the little plastic caps that protect the ends of shoelaces from fraying.
A chromosome’s aglets are its telomeres. They protect a chromosome’s integrity during DNA replication, which plays out many times throughout our lives.
The conventional understanding is that telomeres shorten over time. That’s why their length appeared to be an attractive biomarker of aging.
If you want to spend the money, you can have your white blood cells’ telomere lengths tested. But since even researchers aren’t sure how to interpret the results (too much conflicting evidence), they advise you not to waste your dough [9].
“We recommend against mean LTL (leukocyte telomere length) measurement and share our view that despite interesting mechanistic insights there is yet insufficient evidence to support the clinical use of this biomarker.”
The DNA methylation clocks
The most prominent clocks look at DNA methylation. They are based on the observation that the expression of genes changes with age. Whether a gene is expressed or not depends on the attachment (or lack thereof) of methyl molecules to the gene’s DNA region.
That’s why researchers discovered specific methylation patterns that correlate quite strongly with age. They also developed a variety of DNAm clocks. In theory, they should all measure the same thing: biological age. But they don’t. They come to different conclusions, sometimes even for different organs within the same individual. A recent review, therefore, acknowledged that
“A single best measure of biological aging does not exist, although some DNAm clocks outperform others for specific tasks. Each clock is built according to their unique training method, in which the age range, selected tissue(s), platform/statistical methodology, number of CpGs, and samples are of importance.” [10]
The desirable components of the BioAge clock
Recall how we defined aging as “the progressive decline of function.”
So, back to function at the whole-body or organ level.
To make it into a biological clock (that you and I can use), a function needs to meet all of the following criteria: It needs to be RAMA:
- Reliable: Correlates causatively with health & declines with aging
- Accessible: can be measured easily (ideally day-to-day)
- Modifiable: lifestyle measures have a measurable effect
- Affordable: low-cost monitoring
Reliable
It is surprisingly easy to prioritize our selection of health aspects. Just ask the question: What is the number-one cause of disease, disability, dementia, and premature death? The answer is cardiovascular disease.
That makes vascular function the most attractive biomarker, as I have discussed in another post, “How to stay biologically young.
“Currently, the most practical proxy for biological age is vascular age (VA). The dominant driver of vascular age is endothelial function; the best biomarker for endothelial function is vascular arterial stiffness (AS); and the preferred benchmark for vascular stiffness is pulse wave velocity (PWV)” [11] [12].
PWV is now recognized as the benchmark for EVA (Early Vascular Aging) and SUPERNOVA (Supernormal Vascular Aging) [13].
Accessible
Until a few years ago, only doctors were equipped to measure PWV. But since then, the company Withings has developed a bathroom scale that uses an ingenious method to measure PWV while you take your body weight.
Now, to make one thing abundantly clear: I have no relation to Withings company, I don’t receive any money from them, and I don’t have any affiliate links to them, Amazon, or anyone else. Just so you know, if you decide to buy their scale, I do not benefit at all from your purchase.
I use and admire their product for two reasons: first, it’s the only layperson-suitable PWV device on the market. Second, it has been validated by independent researchers [14].
But, as you’ll see, there is an option for you to estimate your PWV even if you don’t have the Withings device. The reason: PWV has been such a reliable risk predictor that some researchers have tried ways to estimate PWV from calendar age and blood pressure alone. It’s called estimated PWV (ePWV), and I have made the algorithms accessible to you in the downloadable Excel file below.
So, in summary, PWV is accessible as a biomarker.
Modifiable
Endothelial function is supremely responsive to lifestyle interventions. Changes of diets, supplement use, exercise, stress reduction, and sleep have all been shown to affect endothelial function and, consequently, PWV in a matter of days or weeks. I have introduced some of those studies in other posts.
Affordable
The Withings Body Cardio Scale costs about 150 euros here in the EU. I guess in the US or elsewhere, it will cost an equivalent amount in dollars. Given that clinical-grade devices cost somewhere between 20 to 100 times as much, this is absolutely affordable.
Your BioAge Clock
You’ll find a link to a downloadable Excel file at the end of this post. It contains the three BioAge Clock options for you to try. All three options are based on PWV, the most important benchmark I mentioned earlier. You’ll find a more detailed explanation of endothelial function and PWV here, and a brief primer at the end of this post.
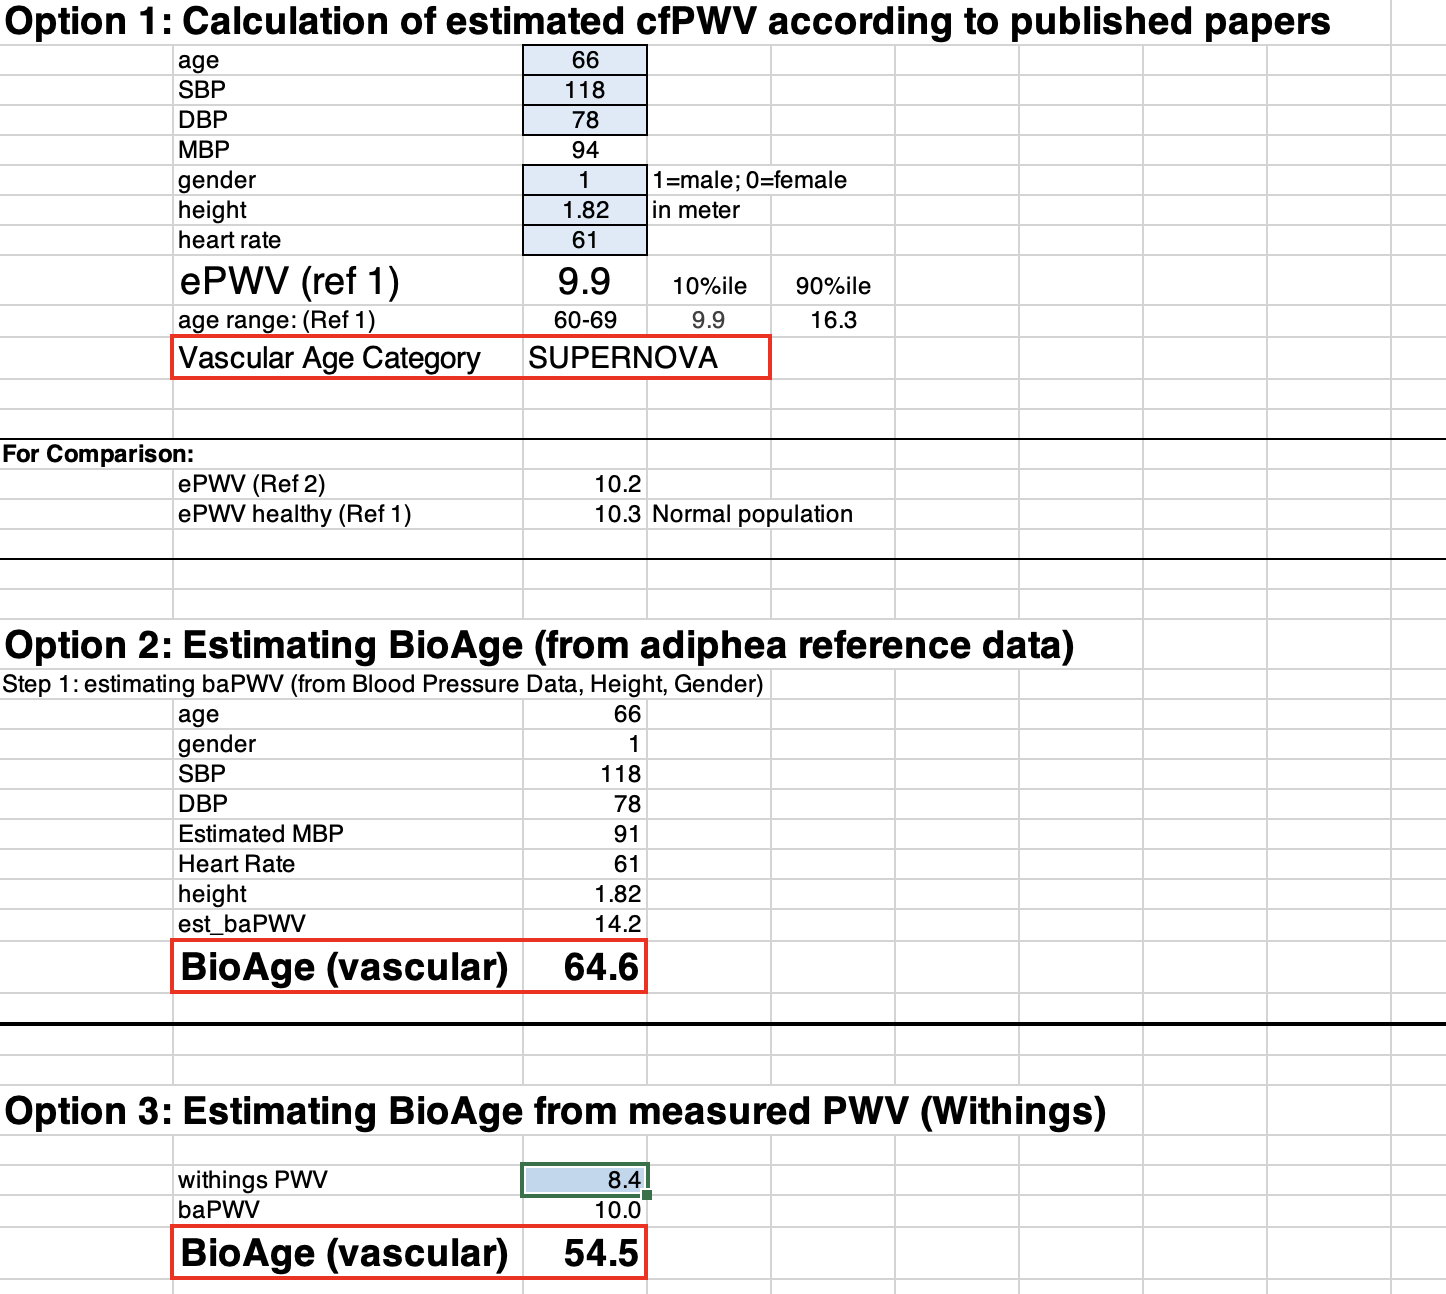
Here is how it looks:
Figure 3
Option 1: ePWV and vascular age
Given (a) the prominence of PWV as a predictor of health and disease and (b) its cumbersome measurement, some researchers have started estimating PWV (ePWV) using more readily available biomarkers. Calendar age and blood pressure yielded the best predictions, although they were not very reliable for most individuals [15] [16].
But since even ePWV correlates with disease risk and helps to differentiate normal vascular aging from EVA and SUPERNOVA, I have programmed the ePWV algorithm into option 1 of the Excel file.
All you need to do is enter your values into the blue data entry fields (age, systolic and diastolic blood pressure, gender, height (in meters), and heart rate). Whatever you enter in option 1 will automatically be used for options 2 and 3, too.
What you’ll get as a result is:
- Your estimated PWV
- Your vascular aging category
- And the 10th and 90th percentiles of ePWV, which are the thresholds for SUPERNOVA (<10th percentile) and EVA (>90th percentile).
Option 2: estimated baPWV and vascular age
Option 2 is fundamentally different from Option 1. The estimated PWV reflects a different segment of the arterial tree. Whereas option 1 estimates the PWV between the carotid (neck) and femoral (upper leg) artery, option 2 estimates the brachial-ankle PWV. That is, the PWV between the upper arm and ankle. baPWV is (almost) always faster than cfPWV, so don’t be surprised to see a significant difference between your ePWV in option 1 and your baPWV in option 2.
Why do we use baPWV?
I could devote an entire post to this subject (if you like me to do that, let me know).
But to cut it short: My team and I found baPWV to be easier to predict and to correlate a lot better with aging and disease than cfPWV and ePWV. You can learn more about our work and reference population in the primer at the end of this post.
Option 3: the Withings-derived vascular age
This is for you if you have the Withings Body Cardio scale that I mentioned earlier. Just enter your PWV, and you’ll get your vascular age estimate. While the Withings app will also give you an indication of your age range—”optimal,” “normal,” and “not optimal,”– we found these ranges to be less precise than what we could do after referencing Withings data with our subject population (read more about this in the primer at the end).
My personal example
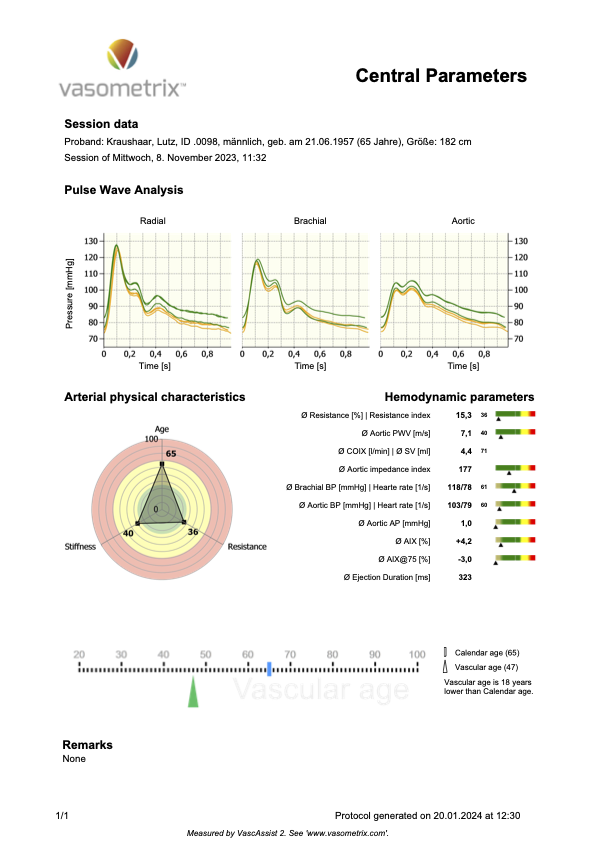
In Figure 4 below, you’ll see a report of my measurements performed with the medical device that we developed (described in the primer below), which measures the physical parameters of endothelial function (in the central aorta, that is equivalent to cfPWV, respectively ePWV).
Figure 4

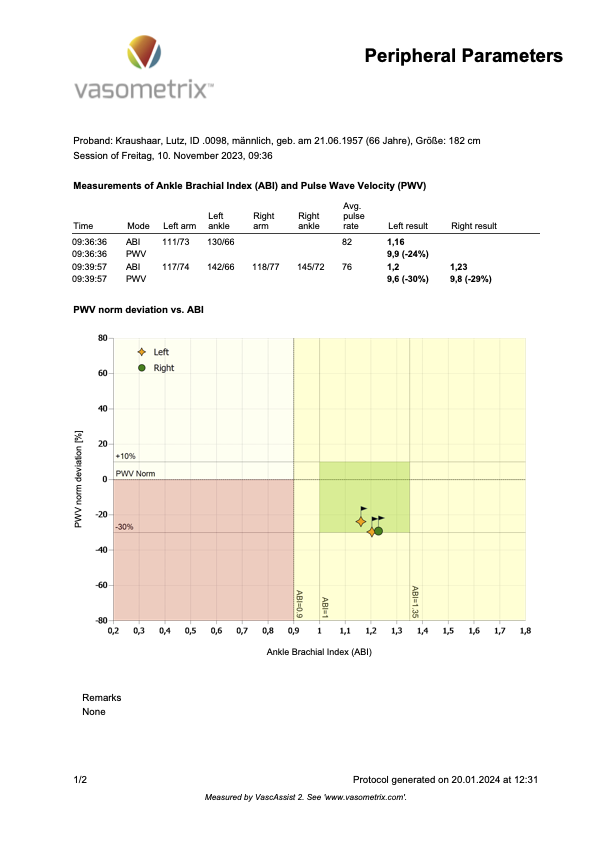
The following Figure 5 shows my baPWV measurement.
Figure 5

Now, here is how these measurements stack up against the three estimation options in the BioAge file.
Figure 6a
Figure 6b
You’ll probably have noticed the difference between my measured central PWV (7.1 m/s) and its estimated equivalent cfPWV in option 1 (9.9 m/s). As PWV goes, that’s a large difference. But option 1 still estimates it to qualify for the SUPERNOVA category (even if just barely). So, not too bad, but you’ll see when you put in your personal numbers how slight changes in blood pressure may shift you from one category into the next.
Also, the range of “normal vascular aging” (from 10th to 90th percentile) is just too wide to give you a benchmark that is sensitive enough to monitor the effects of lifestyle changes.
So, feel free to download this “Everyone’s BioAge clock”, play with it, and ask me anything if you have questions. I might not be able to answer right away, but you’ll definitely get a response.
Now, here is…
The primer about PWV
You’ll find a more detailed explanation of endothelial function and PWV here. Just in brief: PWV describes the speed at which the pulse pressure wave travels through the arterial tree. With every heartbeat, when the ventricle’s valve opens, the pressure generated by the contracting heart muscle creates a pressure wave that propagates at a speed of several meters per second. Don’t mistake this pressure wave for the flow of blood. That is much slower, cm/second, rather than meters.
The pressure wave is what your blood pressure device measures. Your device “sees” only the peak (systolic blood pressure) and the trough (diastolic blood pressure). But when we record a pressure wave millisecond-by-millisecond, it looks like the pressure waves you see in Figures 4 and 5 above.
The unique waveform carries lots of information about endothelial function.
I initiated and scientifically oversaw the development of a new medical device that digitally represents the human arterial tree. When we feed such a pressure wave into that digital model, it uses all the parameters of endothelial function to replicate the pressure wave as closely as possible. In the end, we know how good or poor a person’s endothelial function is. And we know that person’s PWV.
Of course, such a device is suitable only for research labs or medical practices. It is too expensive and a little too cumbersome for laypeople to use.
To get BioAge measurements into the hands of everybody, my team and I have been taking pulse wave recordings (using this device) from more than 2,000 people. From all ages (18 to 90), all health states (from top healthy to really sick cardiac patients), and from all fitness levels (from national-league athletes to couch potatoes). You can read about it here [17], and you’ll find some more of our papers on my Research Gate profile.
This treasure trove of data enabled us to derive a vascular BioAge algorithm and simplify it to PWV as the key biomarker for our BioAge clock for everyone.
Cited References
[1] Hariri E, Yang E, Whelton SP. Personalizing Cardiovascular Disease Risk Assessment: Is it Time to Forget About Chronologic Age? JACC Asia 2023;3:905–7. doi:10.1016/j.jacasi.2023.09.007.
[2] Christensen K, Thinggaard M, McGue M, Rexbye H, Hjelmborg J v B, Aviv A, et al. Perceived age as clinically useful biomarker of ageing: cohort study. BMJ 2009;339. doi:10.1136/bmj.b5262.
[3] Belsky DW, Caspi A, Houts R, Cohen HJ, Corcoran DL, Danese A, et al. Quantification of biological aging in young adults. Proc Natl Acad Sci U S A 2015;112:E4104–E4110. doi:10.1073/pnas.1506264112.
[4] Waziry R, Ryan CP, Corcoran DL, Huffman KM, Kobor MS, Kothari M, et al. Effect of long-term caloric restriction on DNA methylation measures of biological aging in healthy adults from the CALERIE trial. Nat Aging 2023;3. doi:10.1038/s43587–022–00357-y.
[5] Kritchevsky SB, Justice JN. Testing the Geroscience Hypothesis: Early Days. J Gerontol A Biol Sci Med Sci 2020;75:99–101. doi:10.1093/gerona/glz267.
[6] Cohen AA, Kennedy BK, Anglas U, Bronikowski AM, Deelen J, Dufour F, et al. Lack of consensus on an aging biology paradigm? A global survey reveals an agreement to disagree, and the need for an interdisciplinary framework. Mech Ageing Dev 2020;191:111316. doi:10.1016/j.mad.2020.111316.
[7] López-Otín C, Blasco MA, Partridge L, Serrano M, Kroemer G. Hallmarks of aging: An expanding universe. Cell 2023;186:243–78. doi:10.1016/j.cell.2022.11.001.
[8] Belsky DW, Moffitt TE, Cohen AA, Corcoran DL, Levine ME, Prinz JA, et al. Eleven Telomere, Epigenetic Clock, and Biomarker-Composite Quantifications of Biological Aging: Do They Measure the Same Thing? Am J Epidemiol 2017;187:1220–30. doi:10.1093/aje/kwx346.
[9] Bauer SR, Newman JC. Interpreting Geroscience-Guided Biomarker Studies. JAMA Intern Med 2022;182:300–2. doi:10.1001/jamainternmed.2021.7812.
[10] Bergsma T, Rogaeva E. DNA Methylation Clocks and Their Predictive Capacity for Aging Phenotypes and Healthspan. Neurosci Insights 2020;15. doi:10.1177/2633105520942221.
[11] González L del M, Romero-Orjuela SP, Rabeya FJ, del Castillo V, Echeverri D. Age and vascular aging: an unexplored frontier. Front Cardiovasc Med 2023;10:1–12. doi:10.3389/fcvm.2023.1278795.
[12] Weber T, Wassertheurer S, Hametner B, Moebus S, Pundt N, Mahabadi AA, et al. Cross-sectional analysis of pulsatile hemodynamics across the adult life span: Reference values, healthy and early vascular aging: The Heinz Nixdorf Recall and the MultiGeneration Study. J Hypertens 2019;37:2404–13. doi:10.1097/HJH.0000000000002178.
[13] Bruno RM, Nilsson PM, Engström G, Wadström BN, Empana JP, Boutouyrie P, et al. Early and supernormal vascular aging: Clinical characteristics and association with incident cardiovascular events. Hypertension 2020:1616–24. doi:10.1161/HYPERTENSIONAHA.120.14971.
[14] Campo D, Khettab H, Yu R, Genain N, Edouard P, Buard N, et al. Measurement of Aortic Pulse Wave Velocity With a Connected Bathroom Scale. Am J Hypertens 2017;30:876–83. doi:10.1093/AJH/HPX059.
[15] Mattace-Raso FUS, Hofman A, Verwoert GC, Wittemana JCM, Wilkinson I, Cockcroft J, et al. Determinants of pulse wave velocity in healthy people and in the presence of cardiovascular risk factors: ‘establishing normal and reference values.’ Eur Heart J 2010;31:2338–50.
[16] Greve S V, Blicher MK, Kruger R, Sehestedt T, Gram-Kampmann E, Rasmussen S, et al. Estimated carotid-femoral pulse wave velocity has similar predictive value as measured carotid-femoral pulse wave velocity. J Hypertens 2016. doi:10.1097/HJH.0000000000000935.
[17] Kraushaar LE, Dressel A, Massmann A. A novel principled method for the measurement of vascular robustness uncovers hidden risk for premature CVD death. J Appl Physiol 2018;125:1931–43. doi:10.1152/japplphysiol.00016.2018.


0 Comments